A recent analysis using NASA’s Black Marble data reveals that global nighttime artificial light did not simply increase steadily over the past decade but instead exhibited complex patterns of both brightening and dimming across different regions.
The study, published in Nature in April 2026, used data from the Visible Infrared Imaging Radiometer Suite (VIIRS) instruments aboard the Suomi-NPP, NOAA-20, and NOAA-21 satellites. These sensors capture nighttime lights at various wavelengths, allowing researchers to track changes in urban illumination on daily, monthly, and yearly scales from 2014 to 2022.
Global Trends in Nighttime Illumination
The analysis found that global radiance, a measure of artificial light brightness, increased by 34 percent over the study period. However, this overall rise conceals significant regional variation characterized by “bidirectional changes,” where areas of increased brightness exist alongside areas of dimming.
For example, U.S. West Coast cities saw increased brightness corresponding to population growth, while many East Coast cities experienced dimming. The dimming on the East Coast was linked to energy-efficient LED adoption and broader economic shifts. Similarly, rapid urban development corresponded with light increases across China and northern India.
Conversely, parts of Europe showed notable declines in nighttime light. France experienced a 33 percent reduction, the UK 22 percent, and the Netherlands 21 percent dimming. This downward trend accelerated sharply in 2022 during the regional energy crisis triggered by the Russia-Ukraine conflict, which contributed to reduced electricity use and lighting.
Insights from NASA’s Nighttime Light Maps
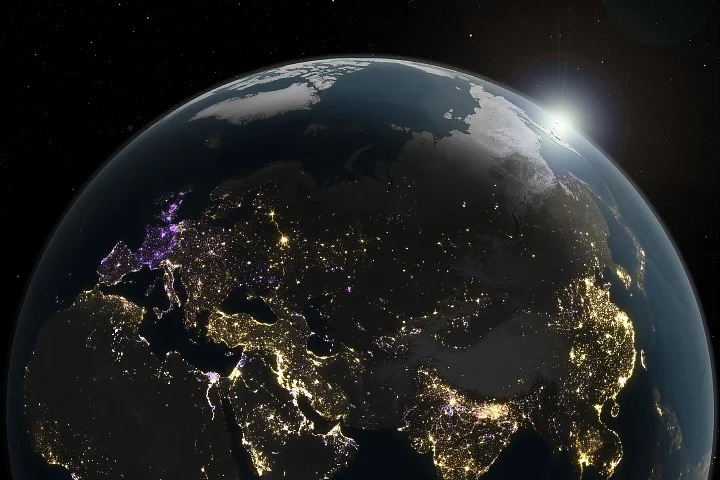
The accompanying maps, covering most of the inhabited world between 60 degrees south and 70 degrees north latitude, depict brightening areas in yellow and gold, and dimming zones in purple. These visualizations highlight fluctuations driven by industrial activity, urban development, policy-driven lighting reforms, economic conditions, and events such as blackouts.
The data also emphasizes the impact of technology transitions, such as the widespread switch to LED streetlights, which can lower artificial light emissions even as urban areas expand.
Animations and large detailed maps are available through NASA’s Scientific Visualization Studio, showcasing annual nighttime light changes and providing a dynamic view of humanity’s shifting nighttime footprint.
Why it matters
This nuanced understanding of global nighttime light dynamics offers valuable insights into patterns of urbanization, energy consumption, and environmental impacts such as light pollution. Tracking how artificial illumination changes over time helps policymakers monitor energy transition efforts, evaluate the effectiveness of lighting regulations, and assess economic or crisis impacts on communities worldwide.
Background
NASA’s Black Marble product has been used for several years to monitor Earth’s nighttime lights systematically. VIIRS sensors detect wavelengths from green to near-infrared, filtering out effects like reflected moonlight and auroras to isolate human-made lighting sources. The recent study expands on earlier research by providing a more detailed temporal and spatial analysis, revealing that changes in nighttime lights are often volatile and regionally varied rather than uniform.
Sources
This article is based on reporting and publicly available information from the following source:
Read more Space & NASA stories on Goka World News.